

Stats: A 2013-14 season comparison
While the headline figure of Liverpool's 2013-14 campaign was of course the leap from seventh to second in the Barclays Premier League, the end-of-season statistics show considerable progress in a range of departments.
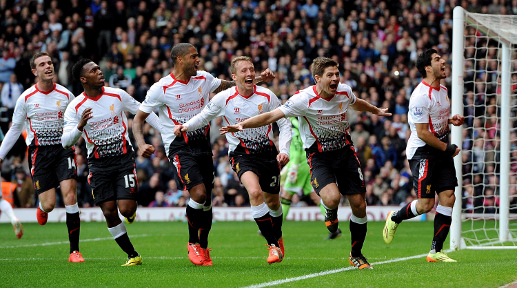
The Reds took the race for the championship until the final day, building a platform to challenge on the back of an 11-match winning streak, which ensured Champions League qualification with three matches to spare.
With the dust now having settled on 10 months of drama, we pored through the facts and the figures to compare and contrast with the numbers from Rodgers' maiden year at the helm.
Take a look through our collection below and let us know your thoughts in the comments section at the bottom of the page. Please note that all statistics refer to the Premier League only.
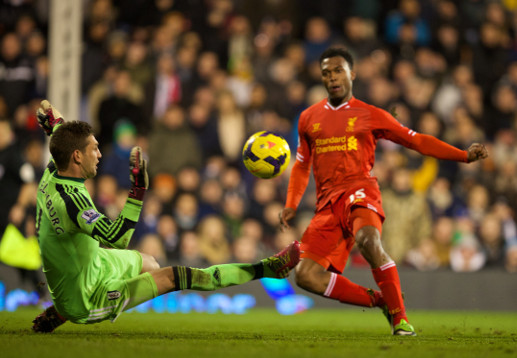
Goals scored
12-13 - 71
13-14 - 101
Average goals per game
12-13 - 1.74
13-14 - 2.79
Goals from inside the box
12-13 - 59
13-14 - 82
Goals from outside the box
12-13 - 12
13-14 - 19
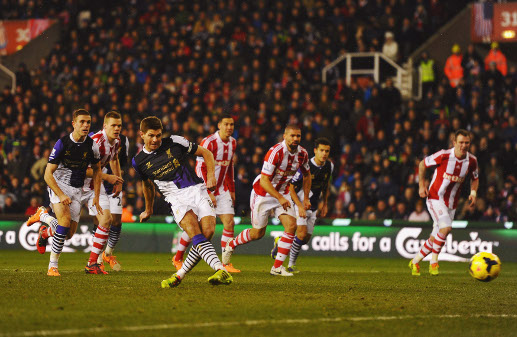
Penalties scored
12-13 - 5 (of 6)
13-14 - 10 (of 12)
Total shots
12-13 - 739
13-14 - 651
Shots on target
12-13 - 232
13-14 - 258
Shots off target
12-13 - 296
13-14 - 263
Shot accuracy
12-13 - 43.9 per cent
13-14 - 49.5 per cent
Conversion rate
12-13 - 13.4 per cent
13-14 - 19.4 per cent
Assists
12-13 - 46
13-14 - 63
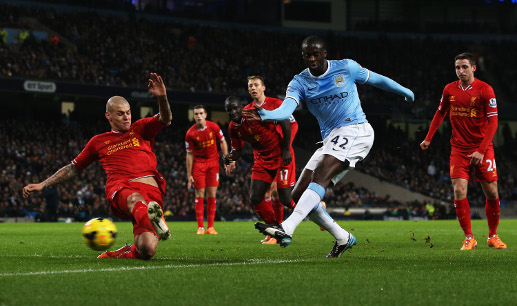
Goals conceded
12-13 - 43
13-14 - 50
Clean sheets
12-13 - 16
13-14 - 10
Tackles won
12-13 - 624
13-14 - 642
Tackle success
12-13 - 78.49 per cent
13-14 - 75.71 per cent

Fouls won
12-13 - 358
13-14 - 411
Fouls conceded
12-13 - 402
13-14 - 411
Yellow cards
12-13 - 54
13-14 - 54
Red cards
12-13 - 2
13-14 - 1
Duels won
12-13 - 2,014
13-14 - 2,278
Average possession
12-13 - 57 per cent
13-14 - 56 per cent
Passing accuracy
12-13 - 84.2 per cent
13-14 - 84.5 per cent
Successful passes
12-13 - 16,667
13-14 - 16,559
Unsuccessful passes
12-13 - 3,135
13-14 - 3,040
Successful crosses
12-13 - 82
13-14 - 78
Unsuccessful crosses
12-13 - 485
13-14 - 383
Cross accuracy
12-13 - 14.5 per cent
13-14 - 16.9 per cent
Successful dribbles
12-13 - 379
13-14 - 471
Unsuccessful dribbles
12-13 - 401
13-14 - 439
Dribble success
12-13 - 48.6 per cent
13-14 - 51.8 per cent
Offsides
12-13 - 110
13-14 - 78
Player debuts
12-13 - 13
13-14 - 9
Average age
12-13 - 23.90
13-14 - 24.31
Average home attendance
12-13 - 44,748
13-14 - 44,671
League finish
12-13 - 7th
13-14 - 2nd